Admin role required: Global Admin, Location Admin, Front Desk Admin and Delivery Manager

Feature availability varies by plan. Check What's in each plan on our pricing page to see if it's included in yours, or talk to our sales team about upgrading.
Delivery Analytics helps you understand how packages move through your workplace. With real-time charts and filters, your team can track delivery volume, pickup speed, and pending packages, so nothing gets missed and every delivery is accounted for.
Note: Delivery Analytics is only available to users subscribed to the Mailroom Management feature.
What Does Delivery Analytics Show?
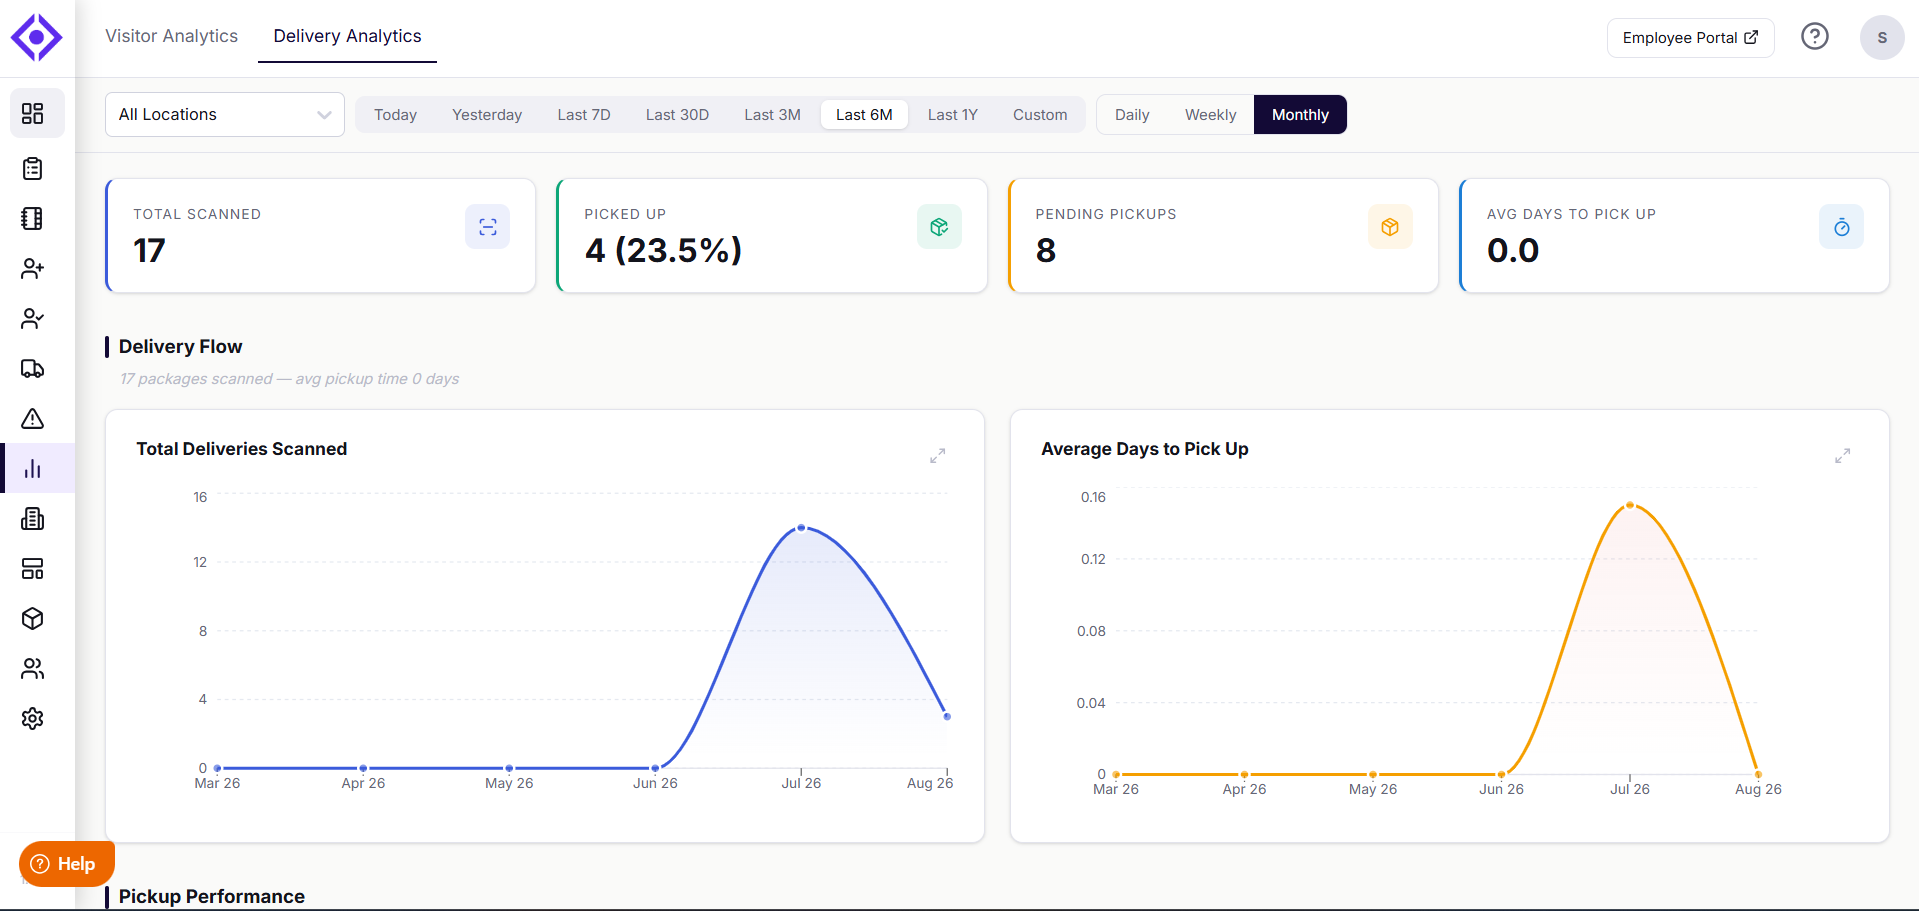
At the top of the dashboard, four summary tiles give you an instant snapshot of activity: Total Scanned, Picked Up, Pending Pickups, and Avg Days to Pick Up. Below them, several charts highlight patterns in your mailroom operations, helping you reduce bottlenecks, improve accountability, and ensure a smoother experience for recipients and mailroom staff alike.
Delivery Flow
- Total Deliveries Scanned — Shows how many packages were logged into the system during the selected timeframe, a quick way to measure overall delivery volume.
- Average Days to Pick Up — Displays how pickup speed trends over time, helping you spot delays and address pickup inefficiencies.
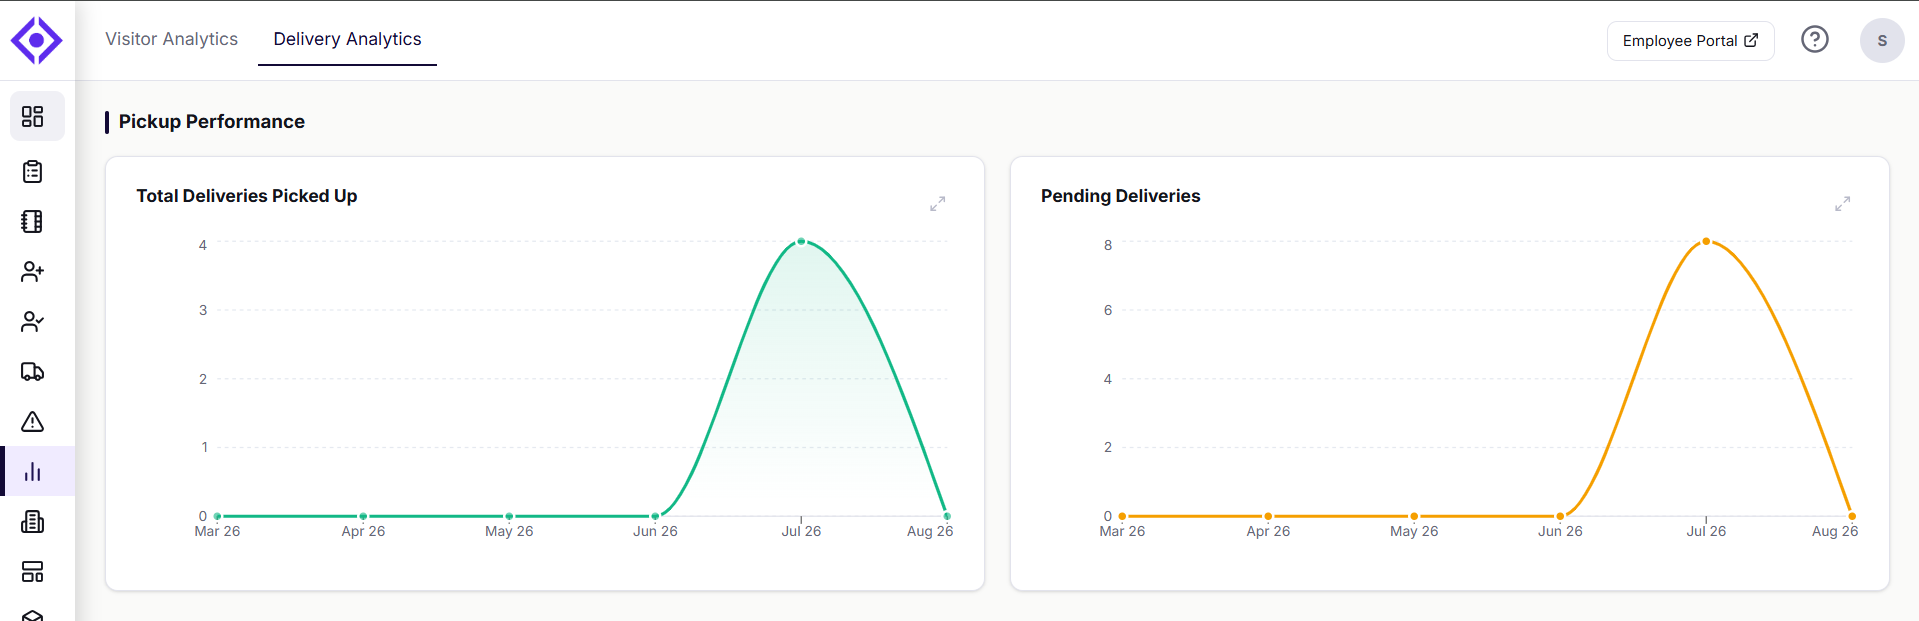
Pickup Performance
- Total Deliveries Picked Up — Tracks how many packages were successfully retrieved over time, a key indicator of recipient responsiveness and mailroom throughput.
- Pending Deliveries — Shows the number of packages still awaiting pickup at any given point, so a growing backlog is easy to catch early.
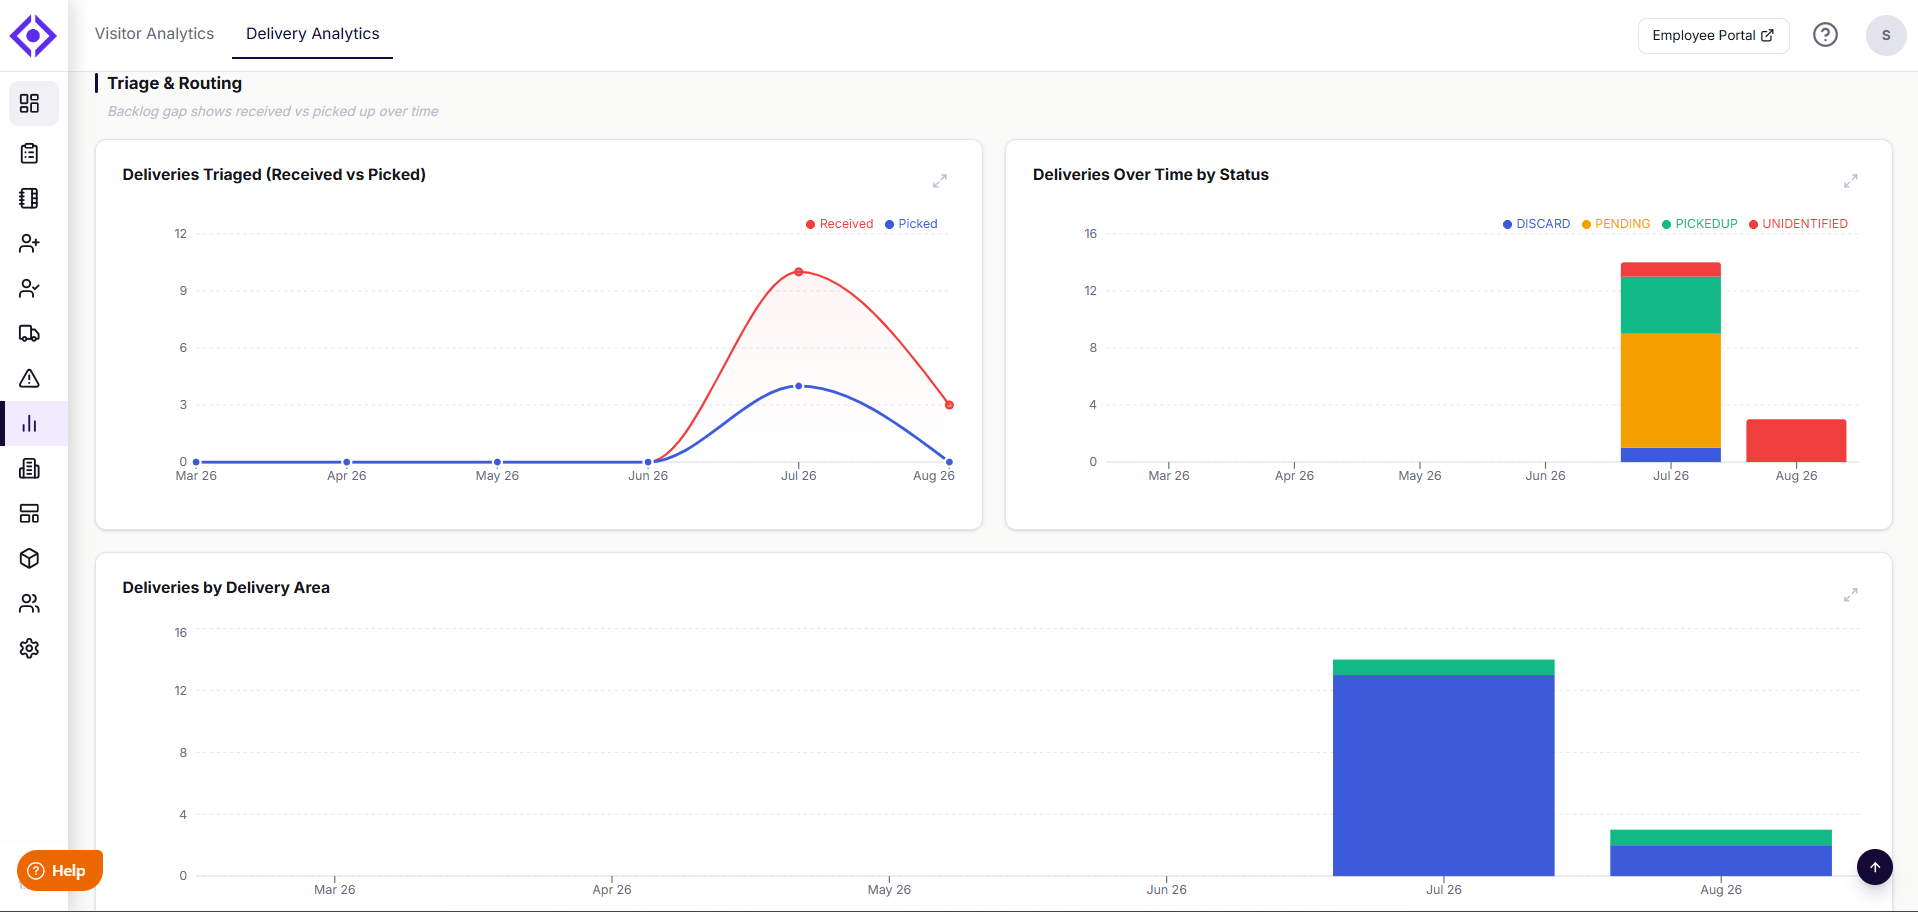
Triage & Routing
- Deliveries Triaged (Received vs Picked) — Compares the number of packages received versus picked up over time, helping you visualize daily handling performance and spot where a gap is opening up.
- Deliveries Over Time by Status — Breaks down every delivery by its current status (Discarded, Pending, Picked Up, or Unidentified), so you can see exactly where deliveries are getting stuck.
- Deliveries by Delivery Area — Breaks down package volume by specific delivery zones in your workplace, useful for identifying high-traffic or overloaded areas.
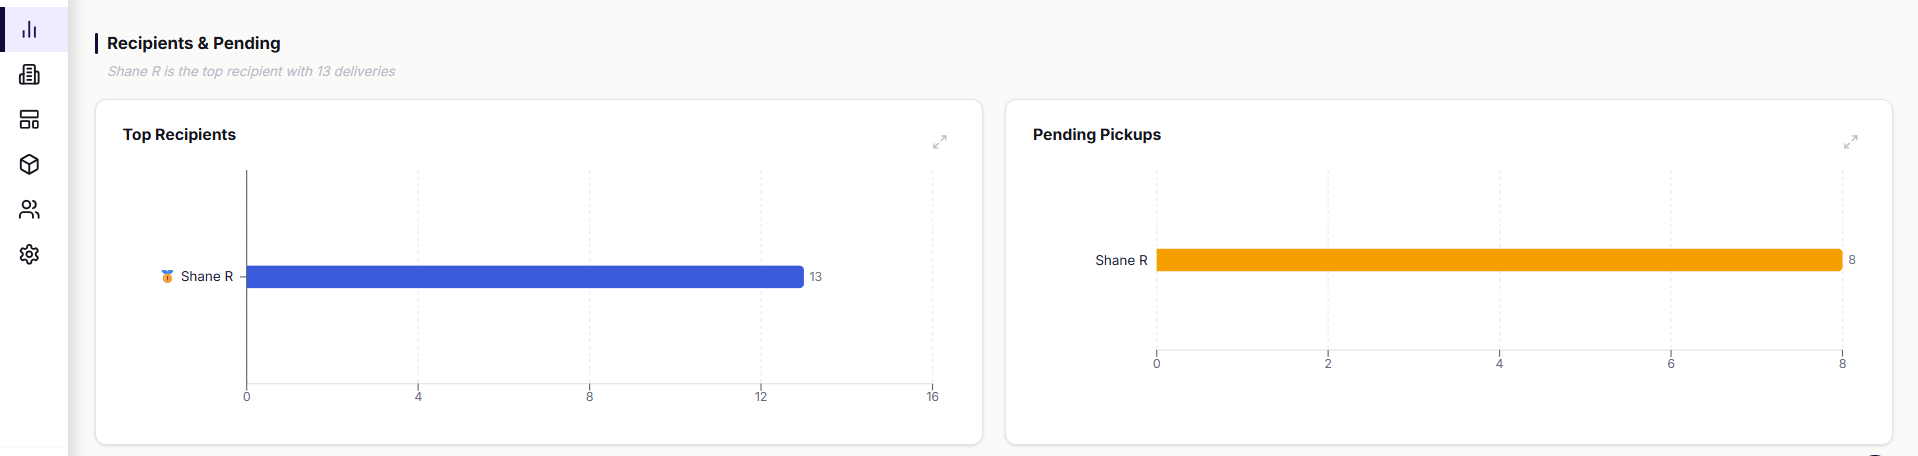
Recipients & Pending
- Top Recipients — Lists who receives the most packages, useful for spotting trends among frequent recipients or departments.
- Pending Pickups — Highlights who currently has the most packages waiting to be collected, so you can follow up directly and reduce backlog.
Exploring Your Charts
Hover over any point on a chart to see the exact figures behind it. Select the expand icon in the top-right corner of a chart to open an enlarged view, and from there, select the print icon to print it or save it as a PDF.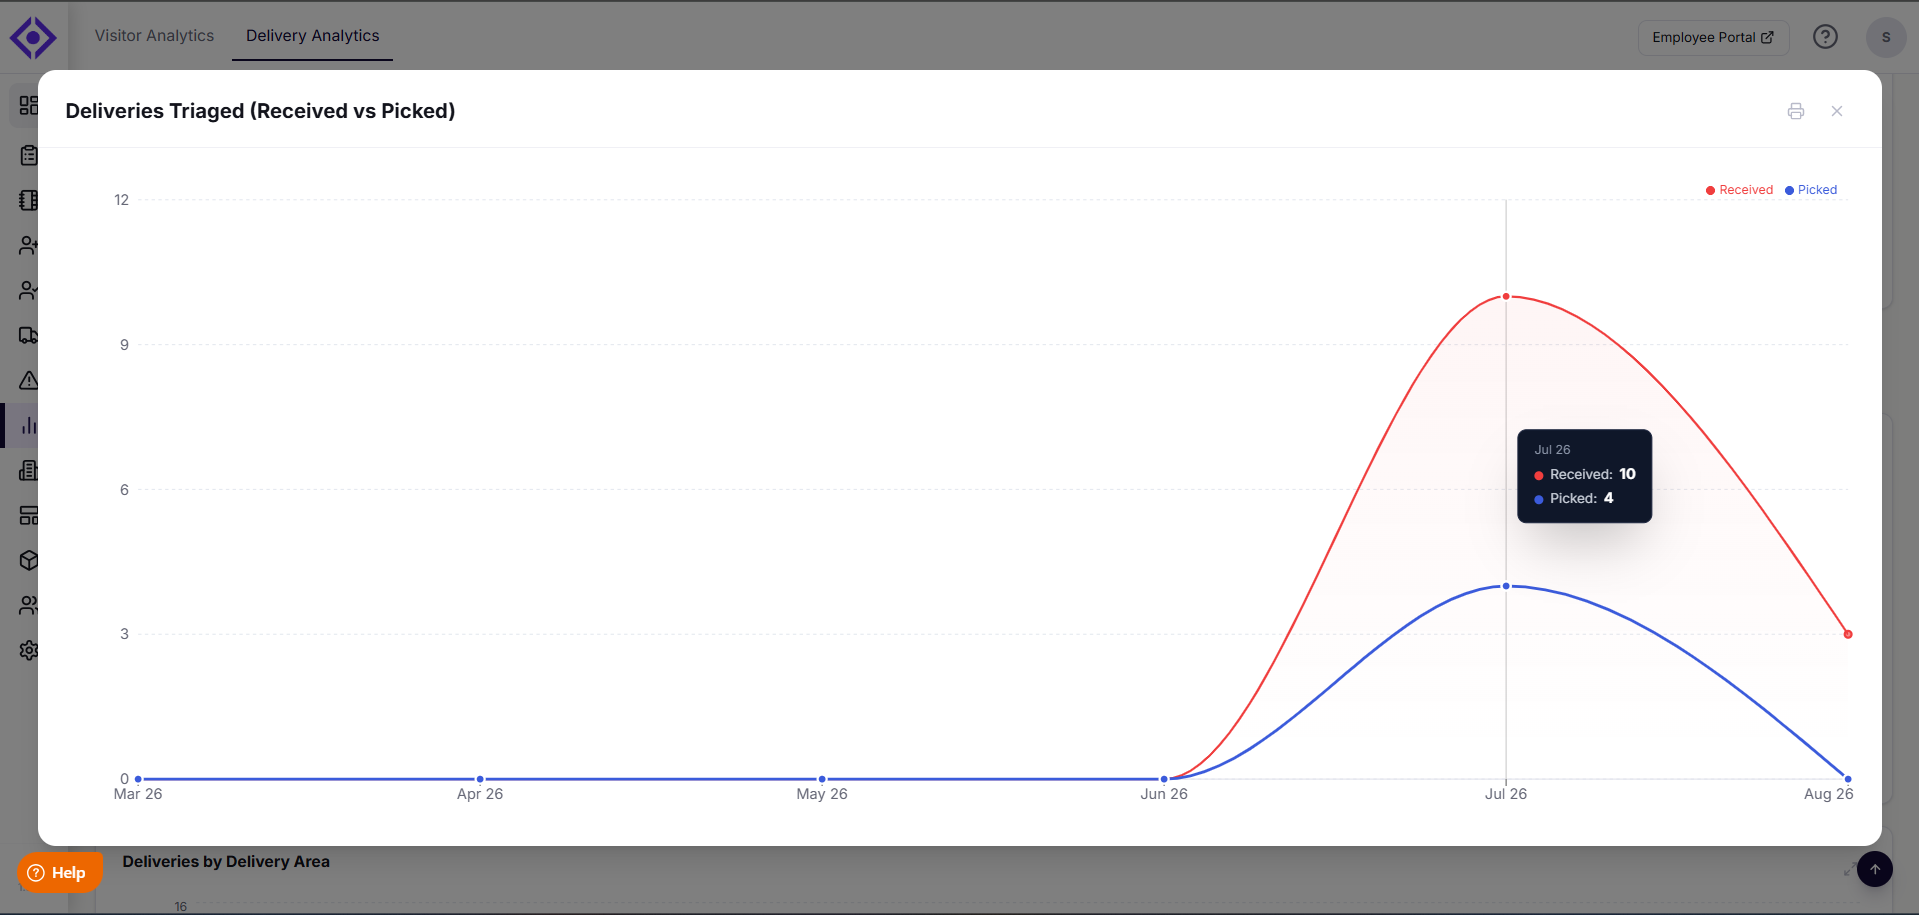
Filters You Can Apply
To get the most relevant insights, apply any of the following filters:
- Duration Filter — Choose how far back to view data: Today, Yesterday, Last 7D, Last 30D, Last 3M, Last 6M, Last 1Y, or a Custom range.
- Location Filter — View deliveries across All Locations, or focus on one specific site. If your organization has a single location, the dashboard automatically reflects that.
- Time Breakdown — Change the chart grouping to Daily, Weekly, or Monthly, depending on the level of detail you need.
With Delivery Analytics, your team can identify trends, act on insights, and ensure no package gets overlooked. It's one more way Visitly helps you run a more efficient, organized workplace.
Troubleshooting
Why don't I see the Delivery Analytics dashboard in my account?
Delivery Analytics is only available to accounts subscribed to the Mailroom Management feature. Contact support@visitly.io to confirm your subscription or request access.
Why is my Avg Days to Pick Up higher than expected?
Check the Duration and Location filters to confirm you're viewing the period and site you intend to evaluate. A rising average often points to recipients who aren't being notified promptly, which the Pending Pickups list can help you investigate.
Why do some deliveries show as "Unidentified" in the status breakdown?
A delivery is marked Unidentified when it's scanned into the system without a recipient match. Review the delivery record in your mailroom log and update the recipient details to move it into the correct status.
Why doesn't a specific delivery area appear in the Deliveries by Delivery Area chart?
Confirm the delivery area is configured correctly in your location settings and that at least one delivery has been logged against it within the selected Duration filter.
Note: Analytics is included on every Visitly plan — Starter, Business, and Enterprise. Business and Enterprise plans also unlock Advanced Analytics, with deeper insights and additional filtering options. For a full comparison, see our pricing page.
Need help? Contact the Visitly support team at support@visitly.io
Was this article helpful?
That’s Great!
Thank you for your feedback
Sorry! We couldn't be helpful
Thank you for your feedback
Feedback sent
We appreciate your effort and will try to fix the article