Overview
The Dashboard is your central hub for real-time insights into visitor activity at your location. When you log in, it gives you a quick overview of what's happening today, including expected visits, on-site visitors, and device status, along with quick access to your live visit list. Use the Visitors, Deliveries, and Global Overview tabs to monitor activity at a single location or across your entire account, and take quick actions like inviting a visitor, creating a visit, or signing someone out.
Accessing the Dashboard
Select Dashboard (the grid icon at the top of the left sidebar) to open it. This is the default screen you land on after logging in.
At the top of the Dashboard, a banner shows the current day and date, a personalized greeting (for example, "Good evening, Shane!"), and the name of the location you're currently viewing (for example, "Half Dome").
Key metrics
Alongside the greeting, four tiles summarize today's activity at a glance:
Expected today — the number of visits scheduled for today.
On-site now — the number of visitors currently checked in.
iPads online — the number of check-in devices currently connected.
iPads offline — the number of check-in devices currently disconnected.
Dashboard tabs
At the top of the page, three tabs let you switch between views:
Visitors — the default view described above, showing today's visitor activity for the selected location.
Deliveries — the same style of overview, focused on package activity for the selected location.
Global Overview — a rolled-up view of visitor activity across every location in your account.
Visitors Dashboard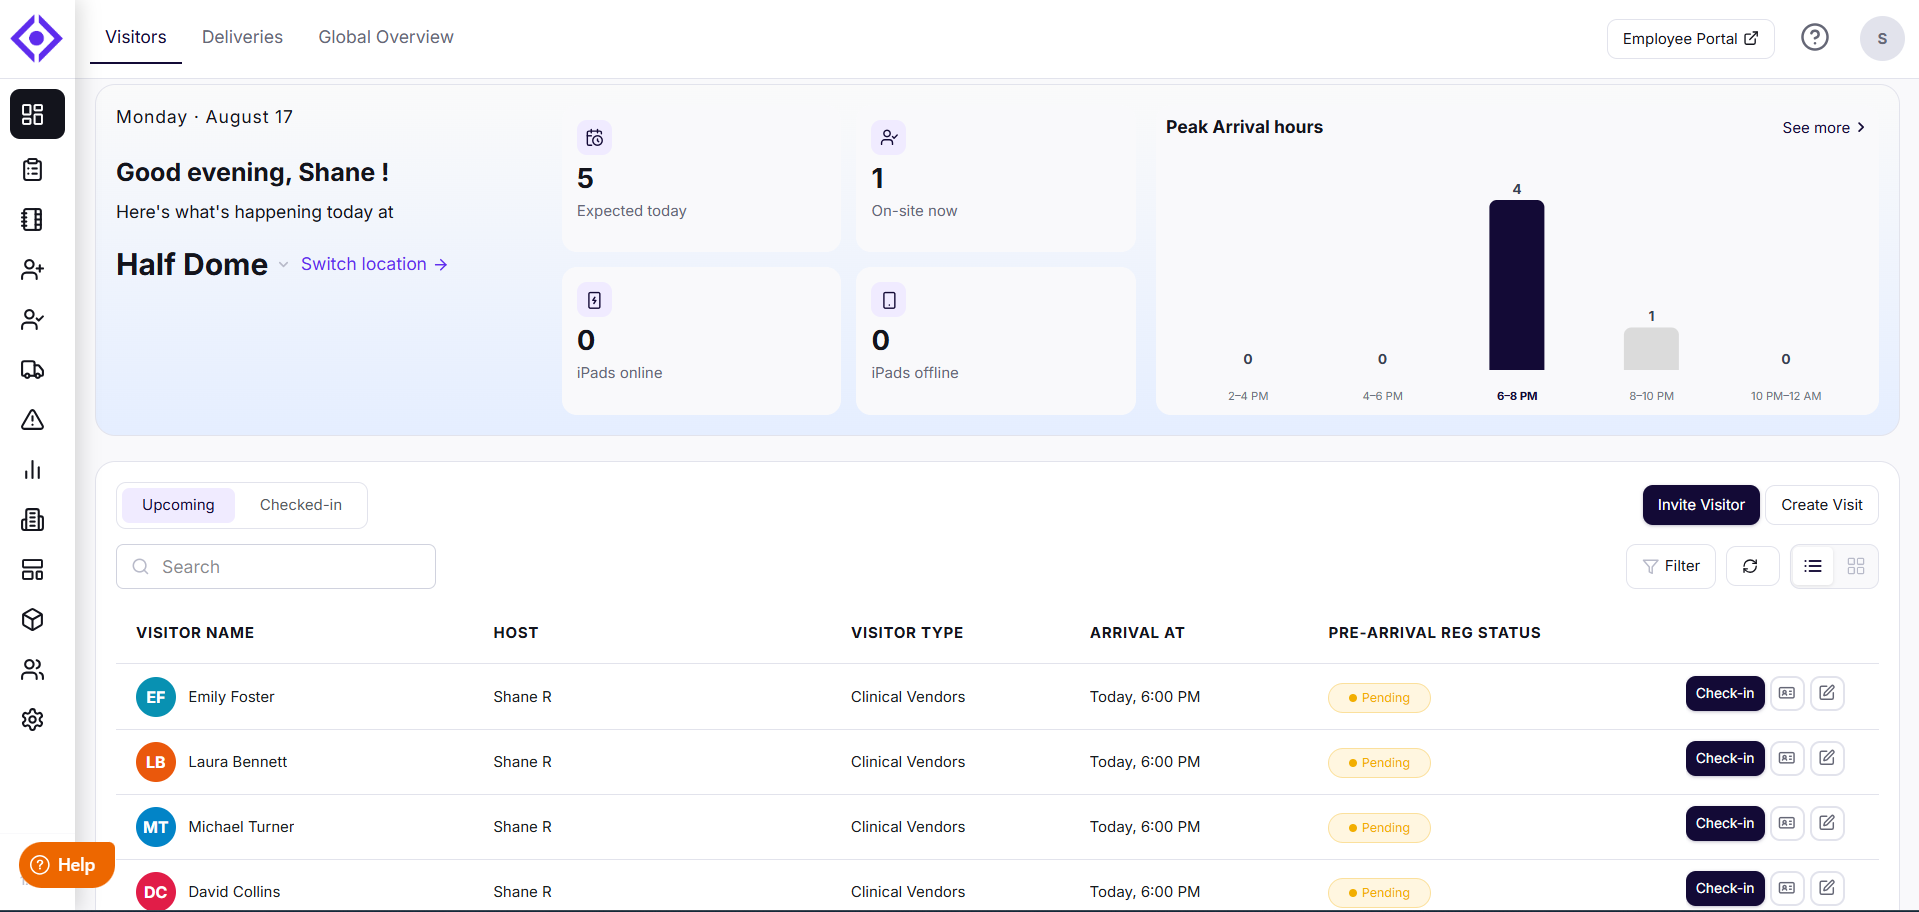
The Visitors dashboard is the default view when you open the Dashboard, showing today's visitor metrics, a breakdown chart, and a live list of upcoming or checked-in visits for your location.
The chart next to the metric tiles changes depending on whether the visit list below is toggled to Checked-in or Upcoming:
With Checked-in selected, it shows Visitors By Type — today's visitors broken down by category (for example, Patients, Family Member, Attendee, Delivery). Each type appears as its own bar. Hover over a bar to see the exact count.
With Upcoming selected, it shows Peak Arrival Hours instead — expected visitor counts grouped into two-hour windows, so you can see when today's arrivals are expected to cluster. Select See more in the top-right of this widget to open a detailed Upcoming panel.
The Upcoming panel
Selecting See more opens a panel with a longer-range view of upcoming visits. It includes:
Date-range tabs — Tomorrow, Next 7 Days, Next 2 Weeks, and Custom.
Four metric tiles for the selected range — Total expected, Visitor types, Pre-arrival completed, and Pre-arrival pending.
Peak Arrival Window chart — expected visitor counts across two-hour windows spanning the full day.
Visitors By Category breakdown — each expected visitor type with its count and percentage of the total.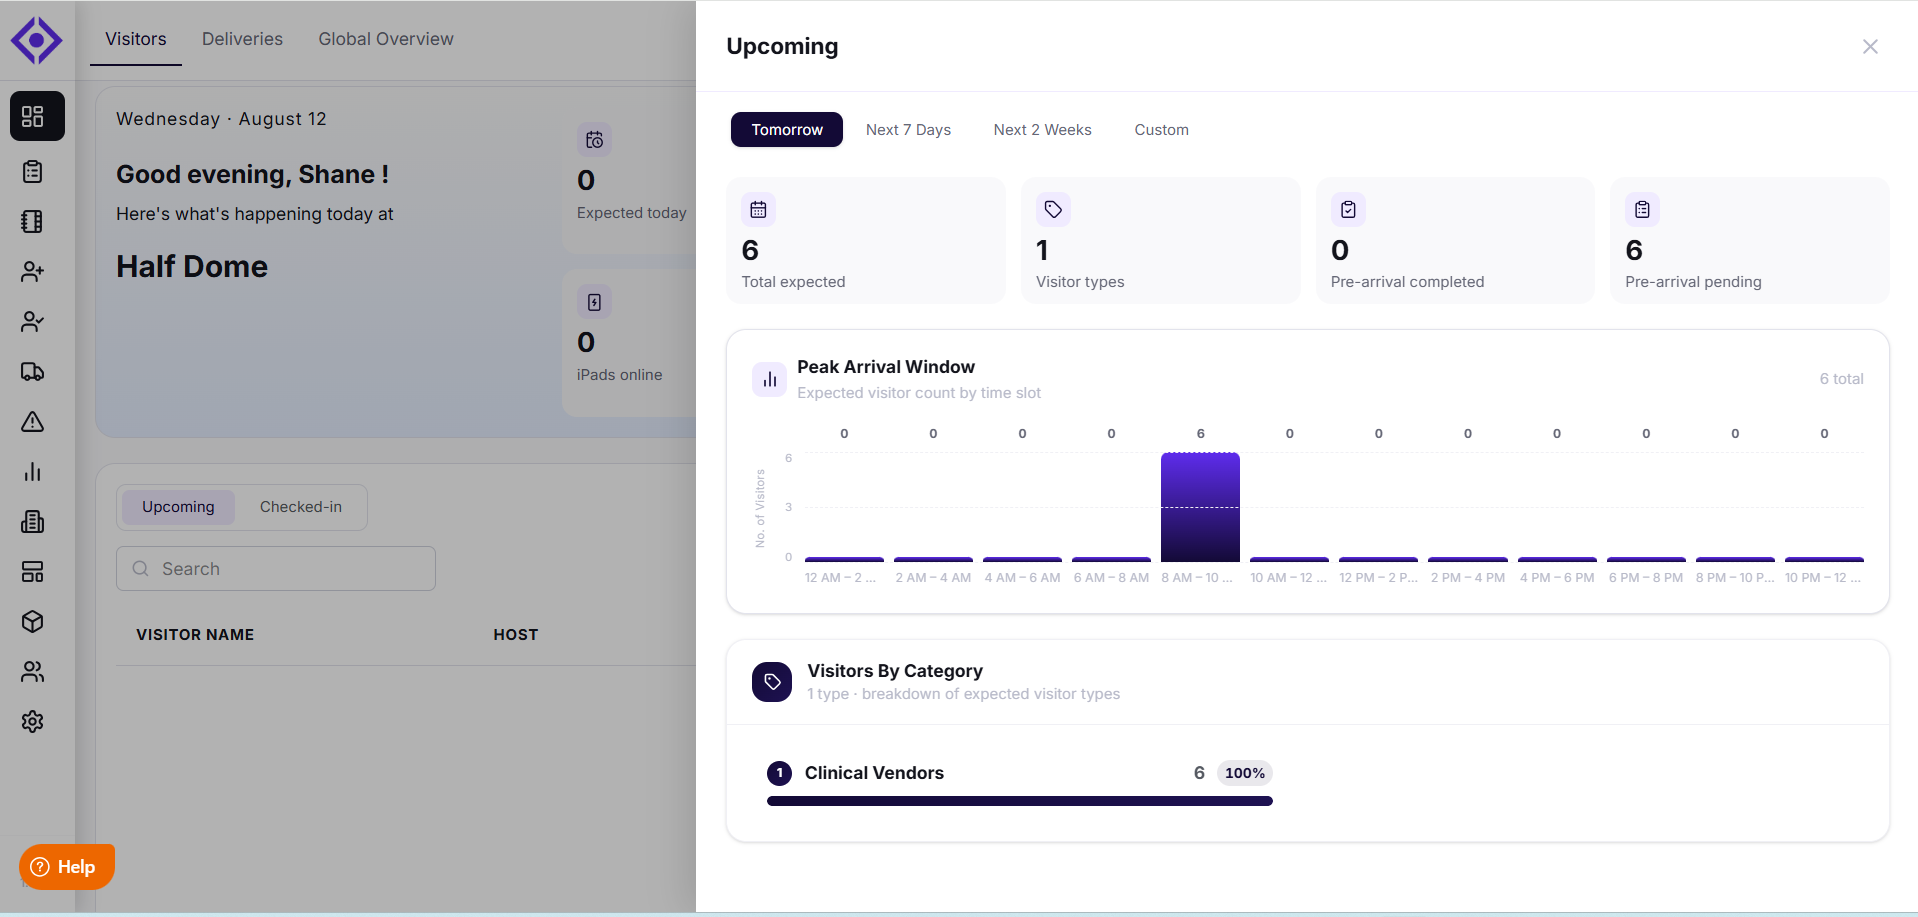
Visitor list
Below the overview section, the Dashboard shows a live list of visits for the selected location.
Use the Upcoming / Checked-in toggle to switch between visits that haven't arrived yet and visits currently on-site.
Use the Search bar to find a specific visit by name.
Select Invite Visitor to send a visitor an invitation ahead of their visit, or Create Visit to log a visit directly.
Use the Filter, Refresh, and List/Grid view icons on the right to adjust what you see and how it's displayed.
Checked-in columns
When the toggle is set to Checked-in, the Visit List includes:
Visitor Name — the visitor's name and avatar.
Host — the host associated with the visit.
Visitor Type — the category of the visit.
Check-In — the date and time the visitor checked in.
Visit Status — the current status of the visit (for example, Approved).
Sign Out — a quick action to sign the visitor out, along with icons to view visitor details or edit the visit.
Upcoming columns
When the toggle is set to Upcoming, the Visit List includes:
Visitor Name — the visitor's name and avatar.
Host — the visitor type or host associated with the visit.
Visitor Type — the category of the visit.
Arrival At — the date and time the visitor is expected.
Pre-Arrival Reg Status — whether pre-registration is still Pending or has been completed.
A Check-in action to check the visitor in directly from the list, along with icons to view visitor details or edit the visit.
Deliveries Dashboard
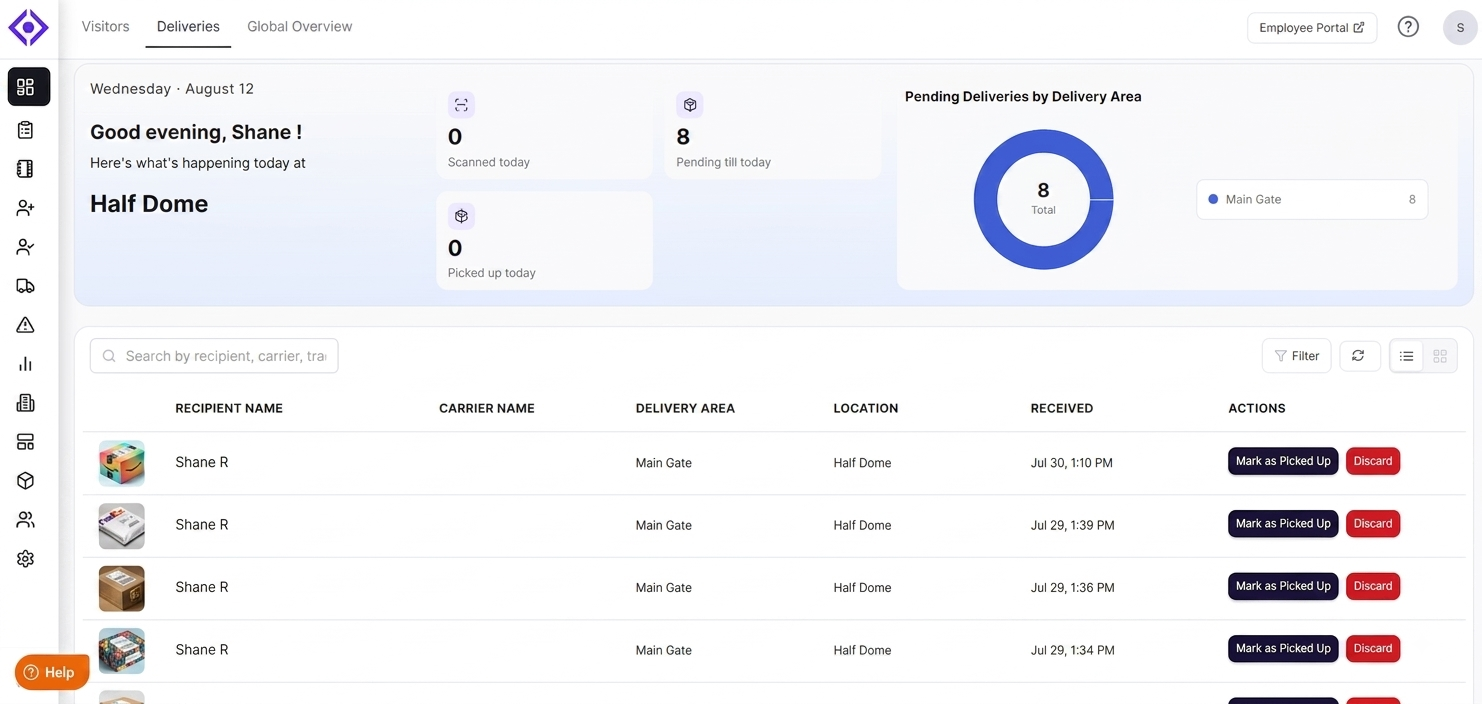
Select the Deliveries tab to see package activity for your current location, in the same layout as the Visitors tab.
Key metrics
Scanned today — the number of deliveries scanned in today.
Pending till today — the number of deliveries still awaiting pickup.
Picked up today — the number of deliveries collected today.
Pending Deliveries by Delivery Area
A donut chart shows the total number of pending deliveries, broken down by delivery area (for example, Main Gate). The total appears in the center of the chart, with each delivery area and its count listed alongside it.
Delivery list
Below the overview, a live list shows deliveries for the selected location.
Use the Search bar to find a delivery by recipient, carrier, or tracking number.
Use the Filter, Refresh, and list/grid view icons on the right to adjust what you see.
The table includes the following columns:
Recipient Name — a photo of the package (if scanned) and the recipient's name.
Carrier Name — the shipping carrier, if known.
Delivery Area — the area the delivery was logged to (for example, Main Gate).
Location — the location the delivery belongs to.
Received — the date and time the delivery was logged.
Actions — select Mark as Picked Up once the recipient collects it, or Discard to remove the entry.
Global Overview Dashboard
Select the Global Overview tab to see a rolled-up summary across every location in your account, rather than just the one you currently have selected.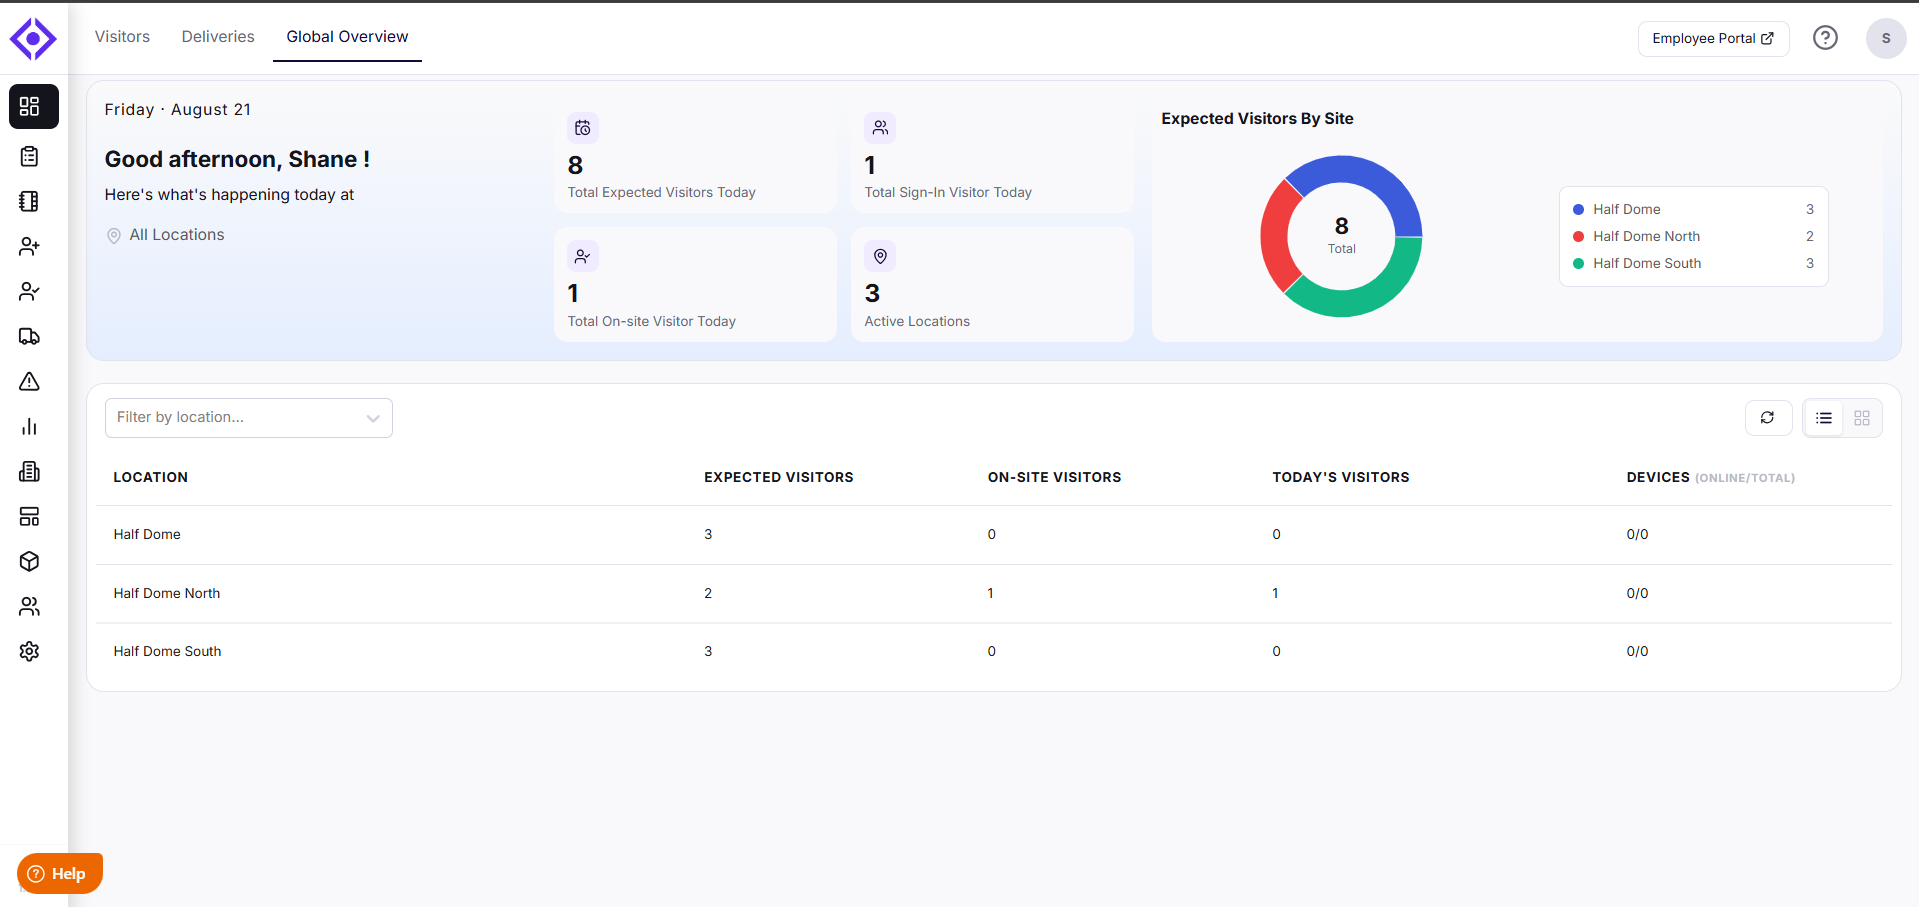
Key metrics
Total Expected Visitors Today — expected visits across all locations.
Total Sign-In Visitors Today — visitors who have signed in today across all locations.
Total On-site Visitor Today — visitors currently on-site across all locations.
Active Locations — the number of locations with activity.
Expected Visitors By Site
A donut chart shows the total number of expected visitors today, broken down by site, with each location and its count listed alongside it.
Location list
Below the overview, a table lists every location in your account, with a Filter by location dropdown and Refresh/list-grid view icons above it. Columns include:
Location — the location name.
Expected Visitors — visits expected today at that location.
On-site Visitors — visitors currently on-site at that location.
Today's Visitors — total visitors for that location today.
Devices (Online/Total) — how many check-in devices are currently online out of the total assigned to that location.
Troubleshooting
My metric tiles show 0 for Expected today, but I know visits are scheduled.
Confirm you have the correct location selected in the greeting banner. Metric tiles on the Visitors and Deliveries tabs reflect data for the currently selected location only.
The chart next to the metric tiles isn't showing what I expect.
Check which toggle the visit list is set to. Visitors By Type only appears when Checked-in is selected, and Peak Arrival Hours only appears when Upcoming is selected.
The iPads offline count doesn't match what I'm seeing on-site.
Check that each device has an active internet connection. A device can appear offline in the Dashboard for several minutes after losing connectivity before the count updates.
A visit or delivery I logged isn't appearing in the list.
Confirm the Upcoming / Checked-in toggle or any active filters aren't hiding the entry, and that you're viewing the correct location.
The Global Overview numbers don't match what I see on the Visitors tab for a single location.
The Global Overview tab always aggregates across all locations. Use the Filter by location dropdown in the location list to check the numbers for a specific site.
Need help? Contact the Visitly support team at support@visitly.io
Was this article helpful?
That’s Great!
Thank you for your feedback
Sorry! We couldn't be helpful
Thank you for your feedback
Feedback sent
We appreciate your effort and will try to fix the article